In the competitive landscape of vacation rentals, where weather conditions and seasonal events dictate market trends, Park City’s February 2025 vacation rental performance emerged as a remarkable success story amid a winter of extremes.
📅 Date Range
- 2/1/2025 – 2/28/2025 vs 2/1/2024 – 2/29/2024
🔑 Key Takeaways
Seasonal Trend
- The first significant storm cycle of winter created excellent ski conditions
- Record-breaking warm temperatures at the beginning of the month
- Presidents Weekend drove peak demand period
Market Insights:
- One of the best-performing months since post-COVID-19 demand
- Occupancy increased 2.59% year-over-year
Overview
February 2025 marked a significant turnaround for Park City’s vacation rental market, with a welcome contrast to January’s challenges. The month delivered the first substantial storm cycle of the winter season, creating excellent ski conditions that perfectly aligned with the high-demand Presidents’ Weekend holiday period. This fortunate timing helped property managers capitalize on peak travel interest after a disappointing start to the ski season.
Despite the positive snowfall, February also presented interesting weather patterns with record-breaking temperatures during the first week of the month. Temperatures ran up to 20°F above seasonal normals, tying a 52-year-old record and highlighting the increasingly unpredictable nature of mountain weather patterns. Nevertheless, the improved snow conditions helped overcome January’s negative publicity from the ski patrol strike, leading to one of the strongest-performing months since the post-COVID-19 demand surge.
 Occupancy
The improved skiing conditions and Presidents’ Weekend holiday period drove a notable increase in occupancy rates, rising from 61.80% in February 2024 to 63.40% in February 2025, representing a 2.59% year-over-year increase as travelers responded positively to the improved mountain conditions.
- 2025: 63.40%
- 2024: 61.80%
- Increase: ⬆️ 2.59%

Park City Occupancy February 2025 vs February 2024.
💵 ADR
The Average Daily Rate (ADR) remained remarkably stable year over year, with only a marginal decrease from $676 in 2024 to $673 in 2025. This decrease, which was minimal at 0.44%, demonstrated property managers’ strategic pricing discipline during a high-demand period.
- 2025: $673
- 2024: $676
- Decrease: ⬇️ 0.44%
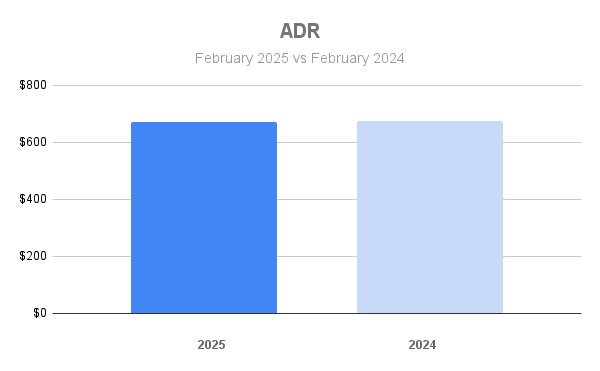
Park City ADR February 2025 vs February 2024.
+💵 RevPAR
The combined impact of increased occupancy and stable ADR resulted in Revenue per Available Room (RevPAR) growth from $418 in 2024 to $426 in 2025, a 1.91% year-over-year increase highlighting the market’s successful recovery from January’s challenges.
- 2025: $426
- 2024: $418
- Increase: ⬆️ 1.91%
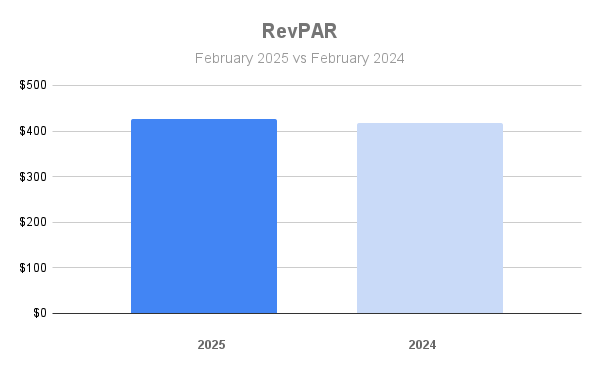
Park City RevPAR February 2025 vs February 2024.
Conclusion
The February 2025 performance metrics underscore the vacation rental market’s resilience and ability to rebound quickly when favorable conditions align. The fortunate timing of significant snowfall with Presidents’ Weekend created ideal circumstances for property managers to capitalize on pent-up demand after January’s challenging start to the season. Despite record-breaking warm temperatures at the beginning of the month, the market demonstrated remarkable adaptability.
This month’s results highlight the critical importance of market timing and the significant impact that weather conditions continue to have on mountain destination performance. Property managers who maintained pricing discipline while effectively communicating the improved conditions were able to drive occupancy gains without sacrificing daily rates, resulting in healthy revenue growth during this crucial mid-winter period.
Compare this to the January 2025 vacation rental statistics.
Park City Property Management
If you’re struggling to maximize your Park City property’s potential and seeking expert guidance to optimize your vacation rental performance, contact our team today for a comprehensive, data-driven evaluation that can transform your revenue management strategy.
Dataset
The data set is based on 61 property managers with 3,200 properties with 0, 1, 2, 3, and 4 bedrooms. The report covers key neighborhoods such as Bear Hollow, Canyons Village, Deer Valley, Jordanelle, Kimball Junction, Old Town, Prospector, and Thaynes Canyon, providing insights into occupancy rates, average daily rates, and revenue per available room within these regions.


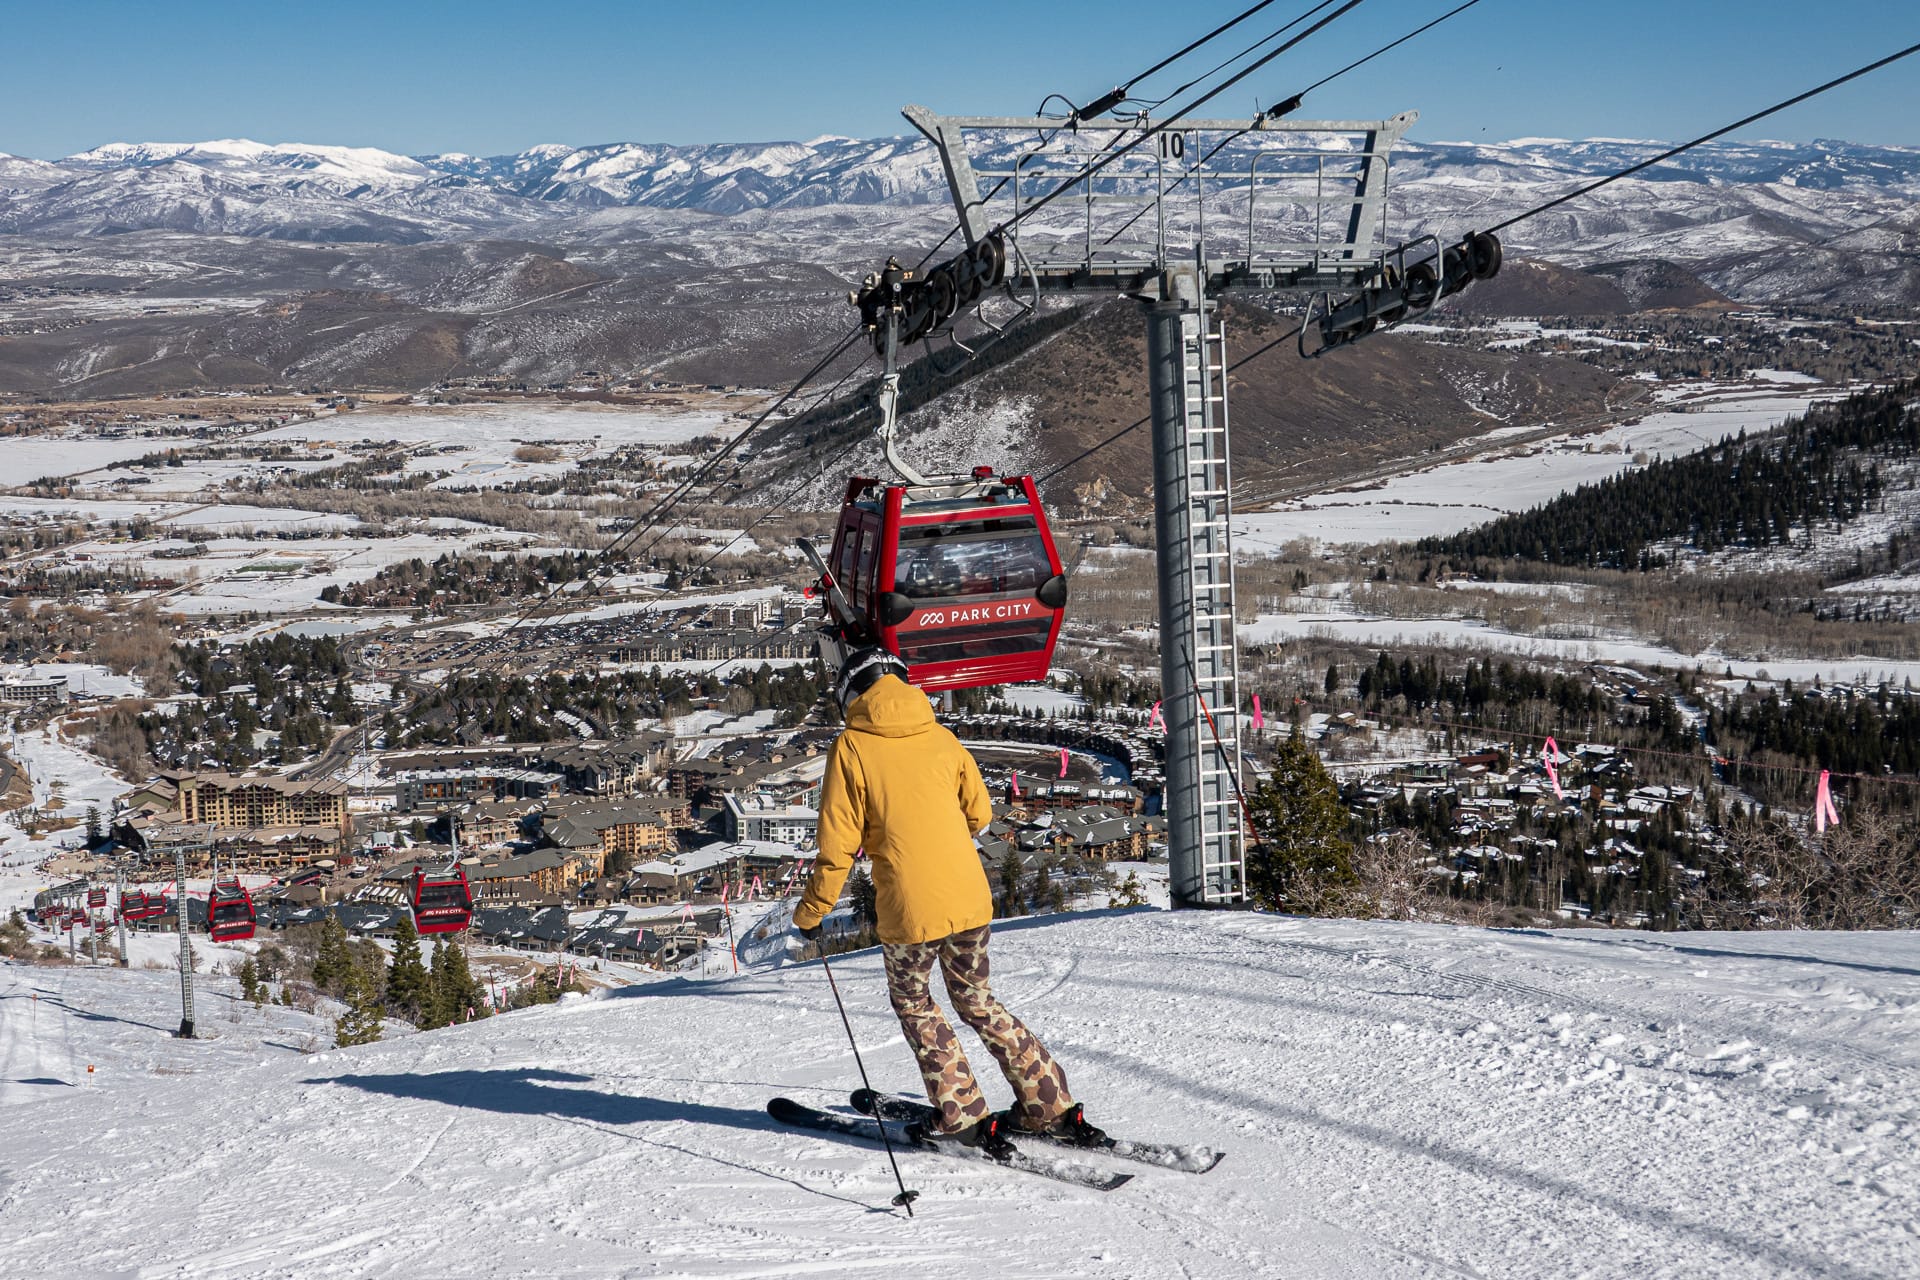
![Your Guide To Park City Mountain Lift Tickets [2024-2025]](https://www.allseasonsresortlodging.com/wp-content/uploads/2023/09/ski-slope-from-lift_1024x1440-1.jpg "Your Guide To Park City Mountain Lift Tickets [2024-2025]")