The Park City Vacation Rental Statistics for September 2024 reveal a downturn in the market as the area transitioned into the fall shoulder season. Decreased traveler demand drove a notable drop in performance.
📅 Date Range
- 9/1/2024 – 9/30/2024 vs 9/1/2023 – 9/30/2023
🔎 Key Takeaways
Seasonal Trend
- The average daytime temperature was 5 degrees warmer in September 2024 than the prior year, and there were only three days of precipitation.
- Occupancy demand in September drops as it’s the start of the fall shoulder season.
Market Insights:
- September 2024 saw a 42.44% decrease in occupancy compared to August 2024.
- Occupancy, ADR, and RevPAR were down compared to the previous year due to lower demand.
Overview
In September 2024, Park City’s vacation rental market experienced a notable decline compared to the previous year, with occupancy down by 20%, ADR decreasing by 2.82%, and RevPAR dropping 20.59%. Despite warmer temperatures and minimal precipitation, demand fell as the market entered the fall shoulder season, resulting in a 42.44% decrease in occupancy from August 2024. Lower demand led to declines across key performance indicators, reflecting the seasonal trend in Park City’s vacation rental market.
Occupancy
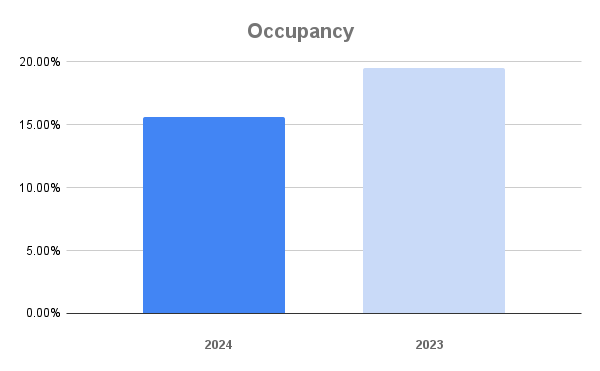
In September 2024, occupancy in Park City’s vacation rental market dropped to 15.60%, a 20% decrease from the 19.50% occupancy rate in September 2023.
- 2024: 15.60%
- 2023: 19.50%
- Increase/Decrease: -20.00%

Park City September 2024 Occupancy
ADR
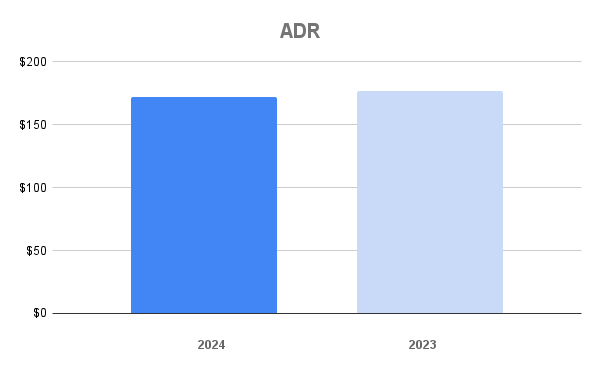
The average daily rate (ADR) in Park City decreased by 2.82% in September 2024, dropping from $177 in 2023 to $172.
- 2024: $172
- 2023: $177
- Increase/Decrease: -2.82%

Park City September 2024 ADR
RevPAR
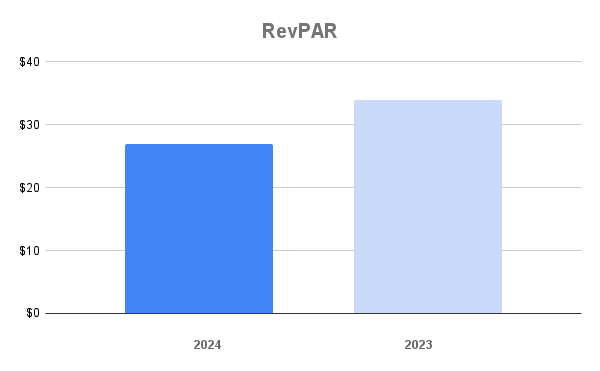
In September 2024, Park City’s RevPAR decreased by 20.59%, falling from $34 in 2023 to $27.
- 2024: $27
- 2023: $34
- Increase/Decrease: -20.59%

Park City September 2024 RevPAR
Conclusion
In September 2024, Park City’s vacation rental market saw declines in occupancy, ADR, and RevPAR compared to the previous year, reflecting reduced demand as the fall shoulder season began.
Compare this to the August 2024 vacation rental statistics.
Dataset
The data set is based on 59 property managers with 3,200 properties with 0, 1, 2, 3, and 4 bedrooms. The report covers key neighborhoods such as Bear Hollow, Canyons Village, Deer Valley, Jordanelle, Kimball Junction, Old Town, Prospector, and Thaynes Canyon, providing insights into occupancy rates, average daily rates, and revenue per available room within these regions.


![Your Guide To Park City Mountain Lift Tickets [2024-2025] Your Guide To Park City Mountain Lift Tickets [2024-2025]](https://www.allseasonsresortlodging.com/wp-content/uploads/2023/09/ski-slope-from-lift_1024x1440-1.jpg)
