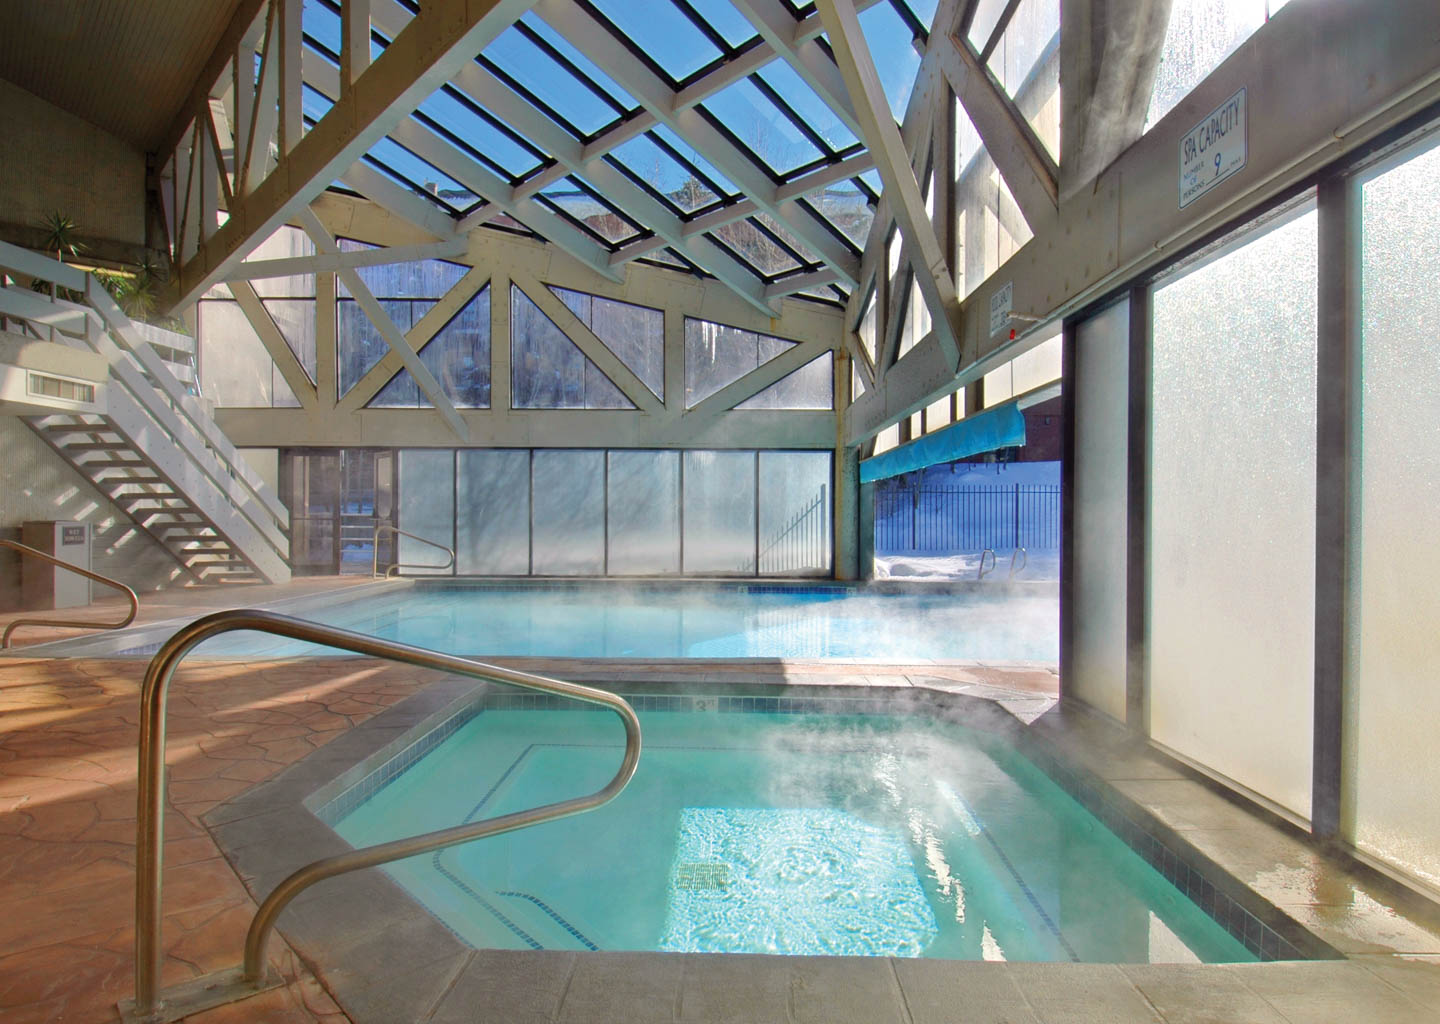
Park City’s vacation rental market statistics shine bright in October 2024, defying shoulder season slump with impressive year-over-year growth!
📅 Date Range
- 10/1/2024 – 10/31/2024 vs 10/1/2023 – 10/31/2023
🔎 Key Takeaways
Seasonal Trend
- The weather was dry and sunny, with a beautiful fall foliage season.
- Occupancy demand in October drops as it’s the fall shoulder season.
Market Insights:
- October 2024 saw an 8.13% decrease in occupancy compared to September 2024.
- Occupancy, ADR, and RevPAR were up compared to the previous year due to higher demand driven by great weather.
Overview
Park City’s vacation rental market experienced a robust October 2024, defying typical shoulder season trends. Despite an 8.13% monthly occupancy decline, year-over-year comparisons revealed significant growth: occupancy rose 26.72% to 14.7%, Average Daily Rate (ADR) increased 3.80% to $164, and Revenue Per Available Rental (RevPAR) surged 33.33% to $24. This uptick was fueled by the area’s stunning fall foliage and exceptionally dry, sunny weather, driving demand and making October a promising month for vacation rentals.
 Occupancy
Occupancy in Park City’s vacation rental market increased by 26.72% in October 2024, reaching 14.7% compared to 11.6% in the same period last year.
- 2024: 14.7%
- 2023: 11.6%
- Increase/Decrease: 26.72%
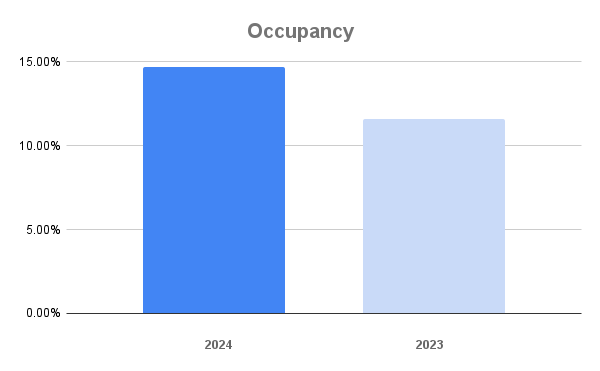
Park City vacation rental Occupancy for September 2024
💲 ADR
The Average Daily Rate (ADR) in Park City’s vacation rental market increased by 3.80% in October 2024, rising to $164 compared to $158 in October 2023.
- 2024: $164
- 2023: $158
- Increase/Decrease: 3.80%
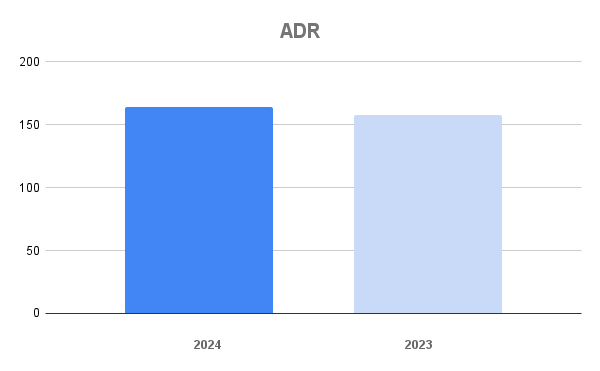
Park City vacation rental ADR September 2024
 +💲 RevPAR
The Revenue Per Available Rental (RevPAR) in Park City’s vacation rental market surged 33.33% in October 2024, thanks to increased ADR and occupancy. It reached $24, up from $18 in October 2023.
- 2024: $24
- 2023: $18
- Increase/Decrease: 33.33%
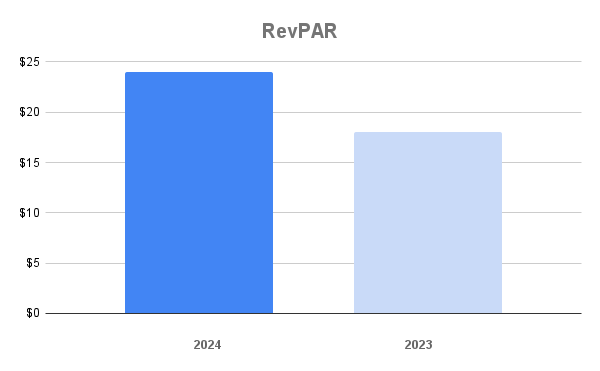
Park City vacation rental RevPAR for September 2024
Conclusion
Park City’s vacation rental market demonstrated resilience in October 2024, with notable year-over-year gains in occupancy, ADR, and RevPAR, driven by favorable weather conditions. Despite seasonal declines, the market’s strong performance signals a promising outlook for the region’s short-term rental sector.
Compare this to the September 2024 vacation rental statistics.
Dataset
The data set is based on 61 property managers with 3,200 properties with 0, 1, 2, 3, and 4 bedrooms. The report covers key neighborhoods such as Bear Hollow, Canyons Village, Deer Valley, Jordanelle, Kimball Junction, Old Town, Prospector, and Thaynes Canyon, providing insights into occupancy rates, average daily rates, and revenue per available room within these regions.



![Your Guide To Park City Mountain Lift Tickets [2024-2025] Your Guide To Park City Mountain Lift Tickets [2024-2025]](https://www.allseasonsresortlodging.com/wp-content/uploads/2023/09/ski-slope-from-lift_1024x1440-1.jpg)
