As the lush landscape began to flourish in June, the Park City vacation rental market followed suit, experiencing a dramatic surge in occupancy.
Despite a cooler start to the month suppressing early bookings, the market saw an impressive 174% increase in occupancy compared to May 2024.
This review delves into the key metrics and trends that shaped June 2024, offering valuable insights for property managers and owners alike.
Date Range: 6/1/2024 – 6/30/2024
Key Takeaways
Seasonal Trend:
- June started slow and built momentum as everything greened up as we got closer to the 4th of July.
- Slightly cooler temperatures at the beginning of the month suppressed bookings.
Market Insights:
- June 2024 saw a 174% increase in occupancy over May 2024.
- There was a decline in paid occupancy and RevPAR, which was consistent with the previous month.
- ADR remained flat year over year.
Overview
In June 2024, the Park City vacation rental market experienced a significant seasonal upswing as the month progressed, despite a slow start due to cooler temperatures. Occupancy surged by 174% compared to May 2024, although it showed a year-over-year decrease. Average Daily Rates (ADR) remained stable, showing minimal change from the previous year. However, Revenue Per Available Room (RevPAR) declined in line with a reduction in paid occupancy, mirroring last month’s trend.
Detailed Metrics
Occupancy:
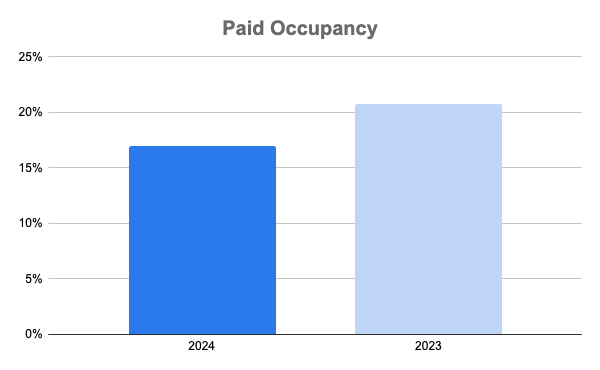
Occupancy in June 2024 decreased by 18.27% compared to June 2023 for Park City vacation rentals.
- 2024: 17%
- 2023: 20.8%
Average Daily Rate (ADR):
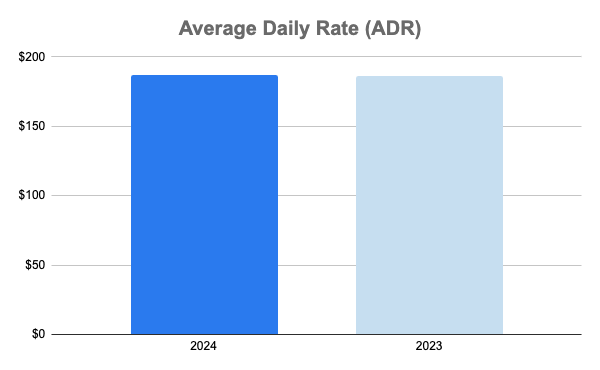
The average daily rate (ADR) in June 2024 remained stable compared to June 2023, with a slight increase from $186 to $187, reflecting a 0.5% rise.
- 2024: $187
- 2023: $186
Revenue Per Available Room (RevPAR):
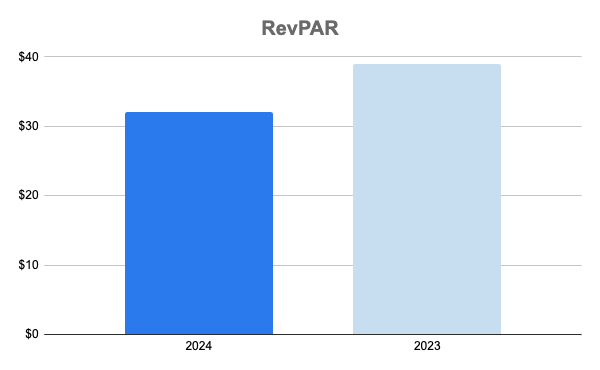
Revenue Per Available Room (RevPAR) in June 2024 experienced a significant decline, dropping by 17.9% from $39 in June 2023 to $32 in June 2024.
- 2024: $32
- 2023: $39
Summary
The Park City vacation rental market in June 2024 demonstrated a notable increase in occupancy compared to May 2024, marking a 174% rise. This uptick was part of a broader seasonal trend, with bookings gaining momentum as the region greened up and approached the 4th of July.
However, compared to June 2023, occupancy declined 18.27%. The Average Daily Rate (ADR) remained relatively stable, with a slight 0.5% increase year over year, suggesting that pricing strategies held steady despite fluctuating demand. Revenue Per Available Room (RevPAR) fell by 17.9%, reflecting the combined impact of decreased occupancy and steady ADR.
Conclusion
June 2024 presented a mixed picture for Park City’s vacation rental market. While occupancy rates surged from May to June, indicating a seasonal recovery, year-over-year comparisons showed a decline. The stability in ADR suggests that property managers maintained consistent pricing strategies despite the varying occupancy levels. Monitoring these trends will be crucial for adjusting strategies to optimize revenue and occupancy as the market progresses into the peak summer season.
Dataset
The data set encompasses information from Key Data, with 60 property managers overseeing 3,550 properties of various sizes, ranging from 0, 1, 2, 3, and 4 bedroom units. Key neighborhoods covered in the report include Bear Hollow, Canyons Village, Deer Valley, Jordanelle, Kimball Junction, Old Town, Prospector, and Thaynes Canyon. This comprehensive data provides valuable insights into occupancy rates, average daily rates, and revenue per available room across these regions.

![Your Guide To Park City Mountain Lift Tickets [2024-2025] Your Guide To Park City Mountain Lift Tickets [2024-2025]](https://www.allseasonsresortlodging.com/wp-content/uploads/2023/09/ski-slope-from-lift_1024x1440-1.jpg)
