July 2024 brought a twist to the Park City vacation rental market, as scorching temperatures in the Salt Lake City valley sent weekend travelers flocking to the mountains. Despite a minor dip in occupancy, savvy property managers capitalized on the heatwave, driving up both Average Daily Rate (ADR) and Revenue Per Available Room (RevPAR). This report delves into how these dynamics played out, providing key insights from Park City’s most sought-after neighborhoods.
Date Range: 7/1/2024 – 7/31/2024
Key Takeaways
Seasonal Trend:
- The weather in Salt Lake City, Provo, and Ogden was anything but typical. Temperatures were consistently above average, with ten days of triple-digit heat. There were more than double the days per year when SLC experienced temperatures of about 100°F.
- The increased temperatures in the valley drove weekend demand in Park City for property managers with effective pricing strategies.
Market Insights:
- July 2024 saw an 88.57% increase in occupancy over June 2024.
- The increase in year-over-year (YoY) ADR was the first time in two months.
- RevPAR saw its first YoY increase in four months.
Overview
In July 2024, the Park City vacation rental market experienced notable changes compared to the previous month and year. Despite a slight year-over-year decrease in occupancy by 1.20%, the market saw a 4.98% increase in Average Daily Rate (ADR) and a 4.48% rise in Revenue Per Available Room (RevPAR). These increases mark the first time ADR has risen year-over-year in two months, and RevPAR has improved for the first time in four months. The hotter-than-average temperatures in the Salt Lake City valley region, which included several days of triple-digit heat, played a significant role in driving demand in Park City, especially during weekends for property managers who employed effective pricing strategies.
Detailed Metrics
Occupancy:
Occupancy in July 2024 decreased by 1.20% compared to July 2023 for Park City vacation rentals.
- 2024: 33.00%
- 2023: 33.40%

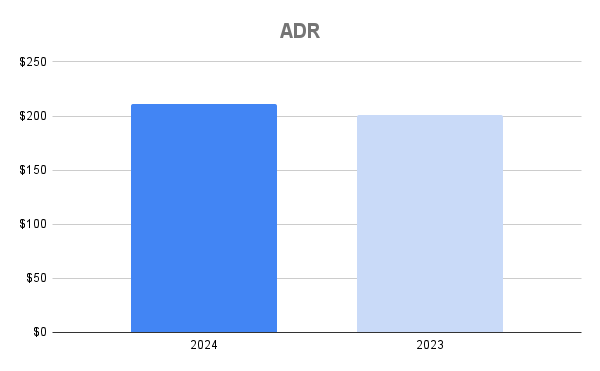
Average Daily Rate (ADR):
The average daily rate (ADR) in July 2024 increased compared to July 2023, increasing from $201 to $211, reflecting a 4.98% rise.
- 2024: $211
- 2023: $201
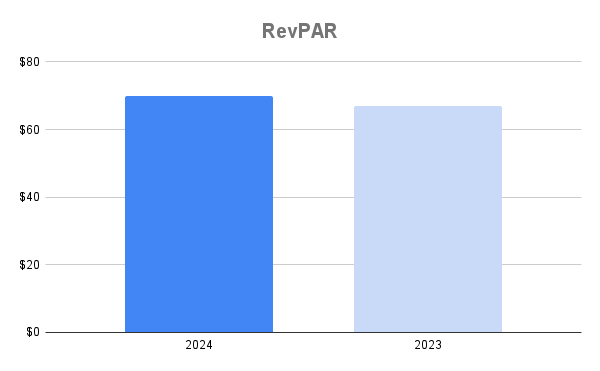
Revenue Per Available Room (RevPAR):
Revenue Per Available Room (RevPAR) increased in July 2024, rising by 4.48% from $67 in July 2023 to $70 in July 2024.
- 2024: $70
- 2023: $67
Conclusion
July 2024’s performance in Park City’s vacation rental market reflects a mixed but generally positive trend. While occupancy slightly declined compared to July 2023, the rise in ADR and RevPAR indicates that the market is recovering, supported by strategic pricing adjustments in response to external factors like the scorching weather.
Compare this to the June 2024 performance.
Dataset
The data set encompasses information from Key Data, with 58 property managers overseeing 3,200 properties of various sizes, ranging from 0, 1, 2, 3, and 4 bedroom units. Key neighborhoods covered in the report include Bear Hollow, Canyons Village, Deer Valley, Jordanelle, Kimball Junction, Old Town, Prospector, and Thaynes Canyon. This comprehensive data provides valuable insights into occupancy rates, average daily rates, and revenue per available room across these regions.


![Your Guide To Park City Mountain Lift Tickets [2024-2025]](https://www.allseasonsresortlodging.com/wp-content/uploads/2023/09/ski-slope-from-lift_1024x1440-1.jpg "Your Guide To Park City Mountain Lift Tickets [2024-2025]")