In the high-stakes world of vacation rentals, where every percentage point can make or break a season, November 2024 emerged as a testament to the resilience and strategic prowess of property managers navigating a complex market landscape.
📅 Date Range
- 11/1/2024 – 11/30/2024 vs 11/1/2023 – 11/30/2023
🔎 Key Takeaways
Seasonal Trend
- Election week slowed reservations as people went to the polls.
- Thanksgiving was the last week of November.
Market Insights:
- November 2024 saw a 39.46% decrease in occupancy compared to October 2024.
- ADR was the only metric that was up compared to the previous year.
Overview
Park City experienced a nuanced market dynamic based on the November performance metrics. While Average Daily Rate (ADR) showed a modest 1.56% increase from $192 in 2023 to $195 in 2024, the overall revenue performance was impacted by a notable decline in occupancy. The occupancy rate dropped from 9.50% in 2023 to 8.90% in 2024, representing a 6.32% year-over-year decrease. This reduction, potentially influenced by the 2024 election week and Thanksgiving falling in the last week of the month, contributed to a more significant 15.00% decline in Revenue per Available Room (RevPAR), which fell from $20 to $17. Despite the consistent weather conditions supporting ski resort operations, these factors collectively suggest a challenging month for our rental portfolio’s financial performance.
 Occupancy
The occupancy rate for Park City vacation rentals declined from 9.50% in November 2023 to 8.90% in November 2024, representing a 6.32% year-over-year decrease, which may be attributed to factors such as the 2024 election week and the timing of Thanksgiving.
- 2024: 8.90%
- 2023: 9.5%
- Decrease: 6.32%
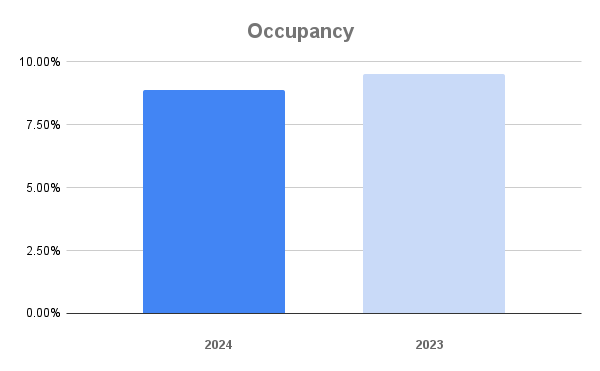
Park City Occupancy November 2024 vs November 2023.
💲 ADR
Despite the challenging booking environment, property managers demonstrated resilience by maintaining pricing discipline. Average Daily Rate (ADR) increased by 1.56% from $192 in 2023 to $195 in 2024, reflecting strategic rate management in a potentially volatile market.
- 2024: $195
- 2023: $192
- Increase: 1.56%
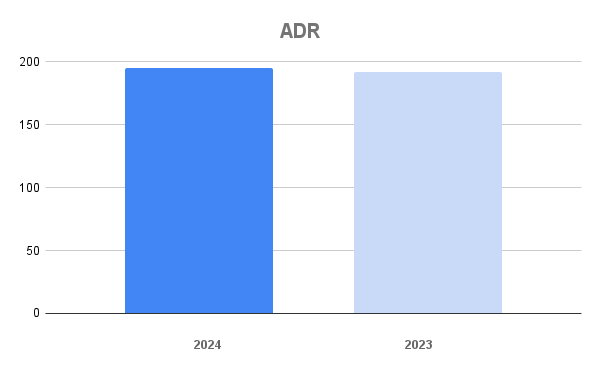
Park City ADR November 2024 vs November 2023.
 +💲 RevPAR
By strategically holding rates slightly higher and increasing ADR by 1.56% from $192 to $195, property managers could not fully offset the 6.32% decline in occupancy, resulting in a more substantial 15.00% decrease in Revenue per Available Room (RevPAR).
- 2024: $17
- 2023: $20
- Decrease: 15.00%
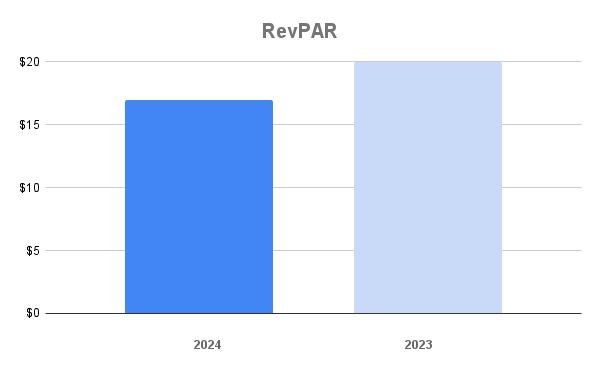
Park City RevPAR November 2024 vs November 2023.
Conclusion
In conclusion, the November 2024 performance statistics underscore the delicate balance between pricing strategy and market demand in the Park City vacation rental sector. While property managers demonstrated pricing resilience by maintaining slightly higher rates, the reduction in occupancy—likely influenced by election week dynamics and Thanksgiving timing—ultimately undermined overall revenue performance. The 15.00% decline in RevPAR highlights the critical importance of rate management and occupancy optimization in maintaining a robust rental portfolio. Strategic approaches that address pricing and booking volume will be essential for navigating increasingly complex market conditions.
Compare this to the October 2024 vacation rental statistics.
Park City Property Management
If you’re struggling to maximize your Park City property’s potential and seeking expert guidance to optimize your vacation rental performance, contact our team today for a comprehensive, data-driven evaluation that can transform your revenue management strategy.
Dataset
The data set is based on 61 property managers with 3,200 properties with 0, 1, 2, 3, and 4 bedrooms. The report covers key neighborhoods such as Bear Hollow, Canyons Village, Deer Valley, Jordanelle, Kimball Junction, Old Town, Prospector, and Thaynes Canyon, providing insights into occupancy rates, average daily rates, and revenue per available room within these regions.


![Your Guide To Park City Mountain Lift Tickets [2024-2025] Your Guide To Park City Mountain Lift Tickets [2024-2025]](https://www.allseasonsresortlodging.com/wp-content/uploads/2023/09/ski-slope-from-lift_1024x1440-1.jpg)
